Can $1 Million Pay $100,000 a Year? My Retirement Math
I rerun a $1 million retirement starting in 2008: 13 full $100,000 withdrawals, then a shortfall in year 14. Here is what an average return misses.
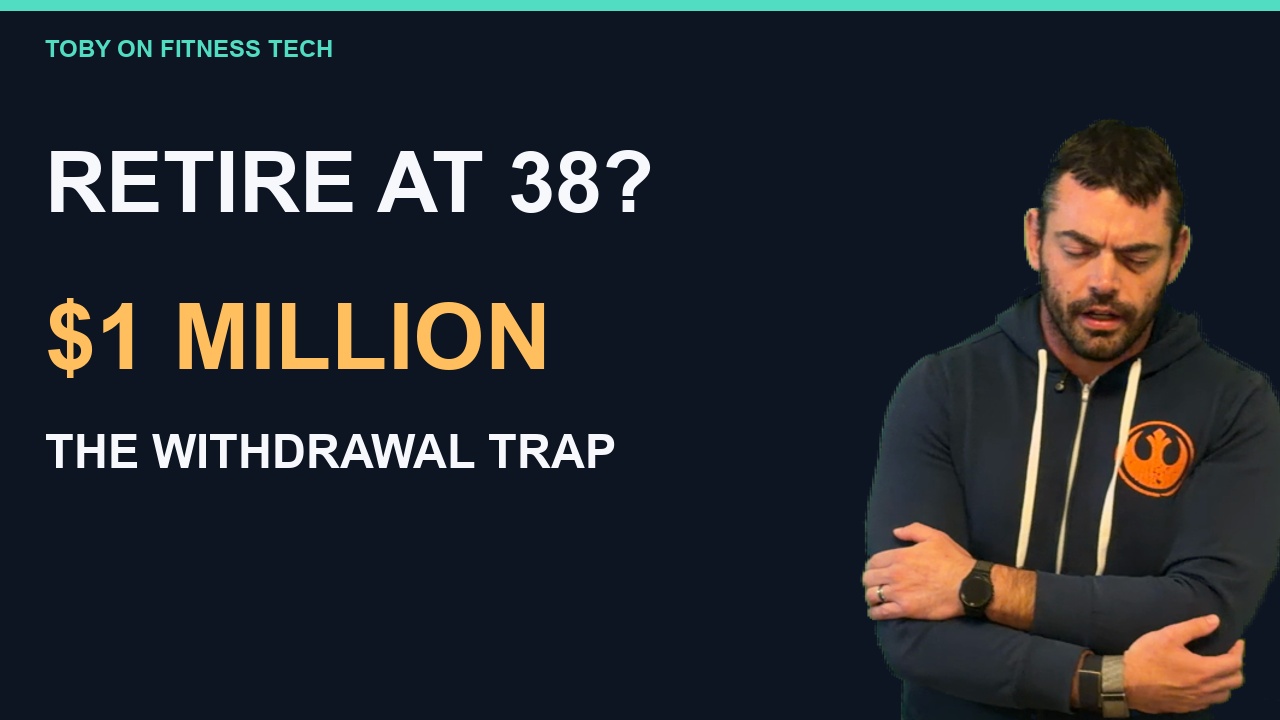
Can a 38-year-old retire with $1 million and take out $100,000 every year? That was the question behind my October 29 episode. The answer I objected to was simple: the stock market averages around 10%, so the withdrawals should take care of themselves.
The problem is the word averages. An average return does not arrive as the same payment every year. Once money is leaving a portfolio, the years in which gains and losses arrive matter.
I used a retirement beginning in 2008 to make that concrete. Here is the corrected calculation: it funds 13 full annual withdrawals of $100,000. In 2021, the 14th year, only $31,443.80 is available for the planned withdrawal.
The assumptions behind the example
This is a historical illustration with a deliberately specific set of rules:
- Start 2008 with $1,000,000 invested in the S&P 500.
- Apply each calendar year's S&P 500 total return, including reinvested dividends.
- Take out a fixed $100,000 at the end of each year.
- Leave out taxes, fees and inflation increases to spending.
The return inputs are the published S&P 500 column in S&P Dow Jones Indices' March 2026 presentation, page 23. The neighboring 3AI strategy column is not used. Balances below use those published annual rates and are rounded to cents for display.
What happens in the first year
The S&P 500 total return for 2008 was −37.00%. In this example, the $1 million becomes $630,000 before the withdrawal. Taking out $100,000 leaves $530,000.
That is the starting point for the next year's recovery. The account no longer has the original $1 million working for it, and the next withdrawal is still $100,000.
My rough spoken estimates in the episode were not the final calculation. The graphics and published notes correct the first-year balance to $530,000 and the depletion point to 2021, year 14. Use those corrected figures when following the example.
The annual balances, through the shortfall
For each row, the previous balance grows or falls by that year's return, then the year-end withdrawal comes out. The final row is different because there is not enough left to take the full amount.
| Year | Total return | Balance after withdrawal |
|---|---|---|
| 2008 | −37.00% | $530,000.00 |
| 2009 | +26.46% | $570,238.00 |
| 2010 | +15.06% | $556,115.84 |
| 2011 | +2.11% | $467,849.89 |
| 2012 | +16.00% | $442,705.87 |
| 2013 | +32.39% | $486,098.30 |
| 2014 | +13.69% | $452,645.16 |
| 2015 | +1.38% | $358,891.66 |
| 2016 | +11.96% | $301,815.10 |
| 2017 | +21.83% | $267,701.34 |
| 2018 | −4.38% | $155,976.02 |
| 2019 | +31.49% | $105,092.87 |
| 2020 | +18.40% | $24,429.96 |
| 2021 | +28.71% | $0.00* |
*2021 ends at zero after a partial withdrawal of $31,443.80. All earlier rows include the full $100,000 withdrawal.
In 2020, a positive 18.40% return still leaves only $24,429.96 after the withdrawal. The 28.71% gain in 2021 brings that remaining balance to $31,443.80 before spending. That is all that can be withdrawn: the final planned payment is $68,556.20 short.
So “it lasts 14 years” needs care. This calculation does not cover 14 complete $100,000 withdrawals. It covers 13, followed by a partial withdrawal in the 14th year.
Why an average return does not settle the question
The early loss and continuing withdrawals reduce the amount of money available to participate in later gains. A strong percentage return on a much smaller remaining balance cannot be treated as the same dollar income as that percentage on the original $1 million.
That is the sequence-of-returns problem I wanted to discuss. The withdrawal plan has to survive the path the portfolio takes, including the bad years. Multiplying the opening balance by an average percentage skips that part of the calculation.
It is also why the age in the original question mattered to me. Someone considering retirement at 38 is asking that money to support a long period of spending. A single return assumption does not describe their time horizon, other income or flexibility to spend less.
What this example can tell us
The 2008 starting point is an adverse historical example, not a forecast or a claim that every retirement starting with $1 million fails. It does show why the average-return argument alone cannot justify this particular fixed withdrawal plan.
Changing the spending amount, withdrawal timing, portfolio or other income changes the result. Taxes and fees would also change it. Keeping withdrawals fixed here means their purchasing power is not protected against inflation.
I am not using this example to name a universally safe withdrawal amount or tell an individual when to retire. The useful question is more specific: what happens to the money when the withdrawals continue through a difficult stretch?
In the episode I also talked about what I want money to make possible for my family. That is the point of doing the math carefully. A plan needs to connect the money available, the time it has to last and the life it is supposed to support.
Watch the full October 29 episode and read its corrected notes. The retirement calculation begins at 2:34. This article discusses a historical illustration, not individualized financial advice.
Choose the next view
Move from the story into the underlying training data
Explore the weekly plan, video library, and the best place to start with the site.
Keep Reading
Related Posts

Beating the 155 BPM Wall: How I Fixed My Post-Hospitalization Running

Why I Still Train Jiu-Jitsu Despite Injuries and a 70lb Weight Cut